 http://www.bewitched.com/song.html
A beautiful visualisation of music as circles. The above is Mozart's Jupiter Symphony. The shape is really aesthetically pleasing, though I may be biased in that since circles are my favourite shape and I consider them the perfect shape.
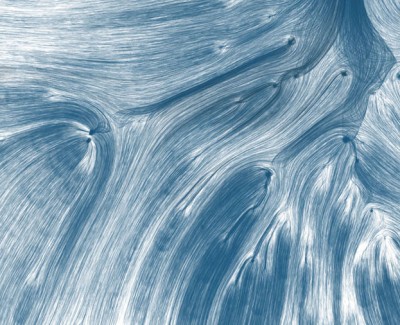
http://flowingdata.com/category/visualization/artistic-visualization/
Has really beautiful examples of data visualisation. My favourite one is the one above by David Wicks. It's about where rain falls in the US and where it is consumed and from that data you get the beautiful visual.
My absolute favourite of all the data visualisations I perused is the We Feel Fine one. It tracks whenever anyone types in "I feel" followed by a feeling and then takes that word and turns it into a coloured dot. Then in the app for We Feel Fine you get a cloud of dots from people around the world. Clicking on a dot gives you the whole sentence from their blog which talks about the feeling. You can even adjust the settings to show feelings for specific ages, genders, weather, date, and any specific feeling. I know it's probably mean but when I feel horrible I now go on it and look for people who are feeling depressed and suicidal so that I can see how much more horrible they feel compared to me, then feel a whole lot better because somebody's having it worse than I am. I think it's that curiosity of wanting to know what other people feel like and the sense of not wanting to feel alone that makes this visualisation so attractive because you can see what other people are feeling like and how many people feel the same as you do.
I think the stress is getting to me because my brain's just not working. It's not producing enough creative juice to give me that burst of inspiration that I need to help my group secure an idea. I need more sleep and let go of everything. Maybe meditating would work.
No comments:
Post a Comment